A hands-on example to label video data using autoencoders – Labeling Video Data-3
In this example, a threshold value of 0.5 is used. Pixels with values greater than the threshold are considered part of the foreground, while those below the threshold are considered part of the background. The resulting binary frames provide a labeled representation of the video data.
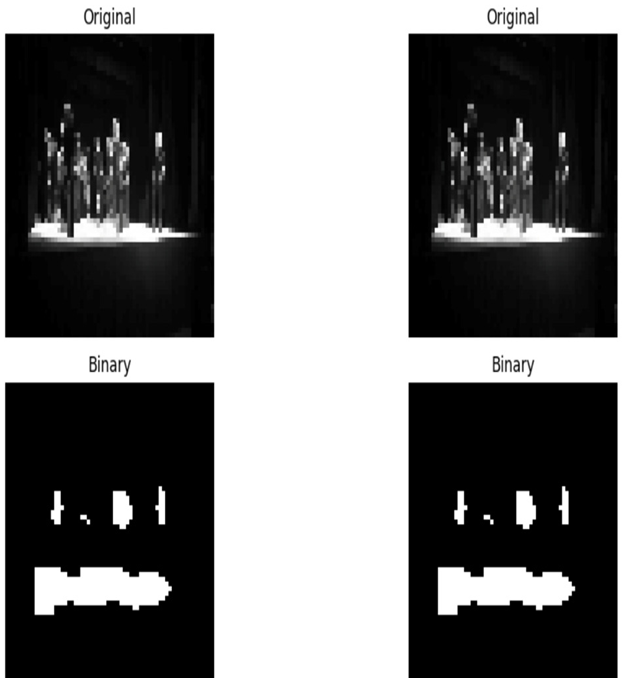
- Visualize the labeled video data: To gain insights into the labeled video data, you can visualize the original frames alongside the corresponding binary frames obtained from thresholding. This visualization helps you understand the effectiveness of the labeling process and the identified objects or regions:
import matplotlib.pyplot as plt
Visualize original frames and binary frames
Let’s visualize the first 2 frames.
num_frames =2;
fig, axes = plt.subplots(2, num_frames, figsize=(15, 6))
for i in range(num_frames):
axes[0, i].imshow(test_data[i], cmap=’gray’)
axes[0, i].axis(‘off’)
axes[0, i].set_title(“Original”)ocess
axes[1, i].imshow(binary_frames[i], cmap=’gray’)
axes[1, i].axis(‘off’)
axes[1, i].set_title(“Binary”)
plt.tight_layout()
plt.show()
The plt.subplots(2, num_frames, figsize=(15, 6))function is from the Matplotlib library and is used to create a grid of subplots. It takes three parameters – the number of rows (two), the number of columns (two), and figsize, which specifies the size of the figure (width and height) in inches. In this case, the width is set to 15 inches, and the height is set to 6 inches.
By plotting the original frames and the binary frames obtained after the encoding and decoding process side by side, you can visually compare the labeling results. The original frames are displayed in the top row, while the binary frames after the encoding and decoding process are shown in the bottom row. This visualization allows you to observe the objects or regions identified by the autoencoder-based labeling process.

Figure 9.6 – The original images and binary images after encoding and decoding
The autoencoder model you have trained can be used for various tasks such as video classification, clustering, and anomaly detection. Here’s a brief overview of how you can use the autoencoder model for these tasks:
- Video classification:
- You can use the autoencoder to extract meaningful features from video frames. The encoded representations obtained from the hidden layer of the autoencoder can serve as a compact and informative representation of the input data.
- Train a classifier (e.g., a simple feedforward neural network) on these encoded representations to perform video classification.
- Clustering:
- Utilize the encoded representations to cluster videos based on the similarity of their features. You can use clustering algorithms such as k-means or hierarchical clustering.
- Each cluster represents a group of videos that share similar patterns in their frames.
- Anomaly detection:
- The autoencoder model is trained to reconstruct normal video frames accurately. Any deviation from the learned patterns can be considered an anomaly.
- You can set a reconstruction error threshold, and frames with reconstruction errors beyond this threshold are flagged as anomalies.
Now, let’s see a how to extract the encoded representations from the training dataset for video classification, using transfer learning.
Leave a Reply